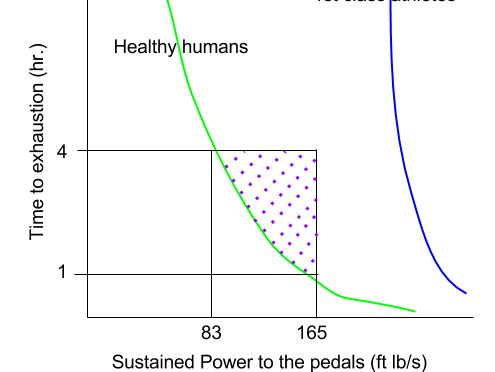
If a picture is worth a thousand words then a graph or chart is worth at least a thousand words. The ability to understand and create graphs or figures is essential for anyone interested in Science Technology Engineering or Mathematics. Here’s a great example of how one might “boil down” a figure for their own… Continue reading Data and Information Visualization
